Driver-Side Intelligence Preview
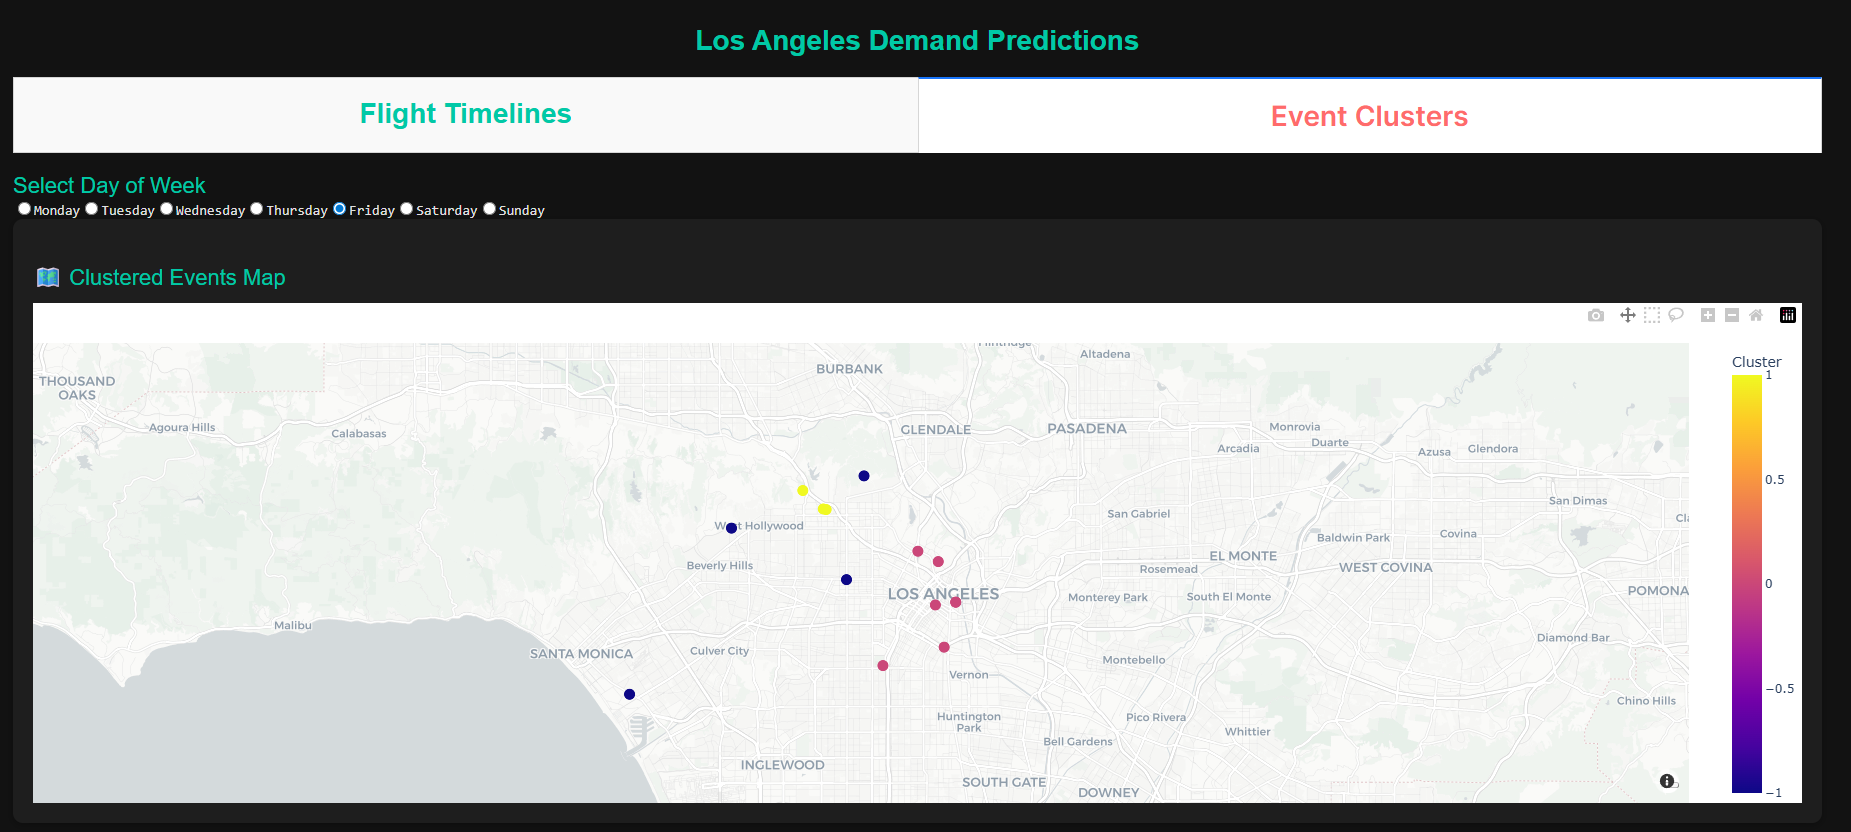
Event Clustering Map
This map visualizes weekly city events using color-coded clustering. Each color represents a density-based cluster, signaling potential surge zones. Drivers can anticipate high-demand areas by tracking color saturation and proximity. A data table below provides event details—start/end times and addresses—for precise positioning.This map visualizes weekly city events using color‑coded clustering. Each color represents a density‑based cluster, signaling potential surge zones. Carriers can anticipate high‑demand areas by tracking color saturation and proximity. A data table below provides event details—start/end times and addresses—for precise staging and planning.
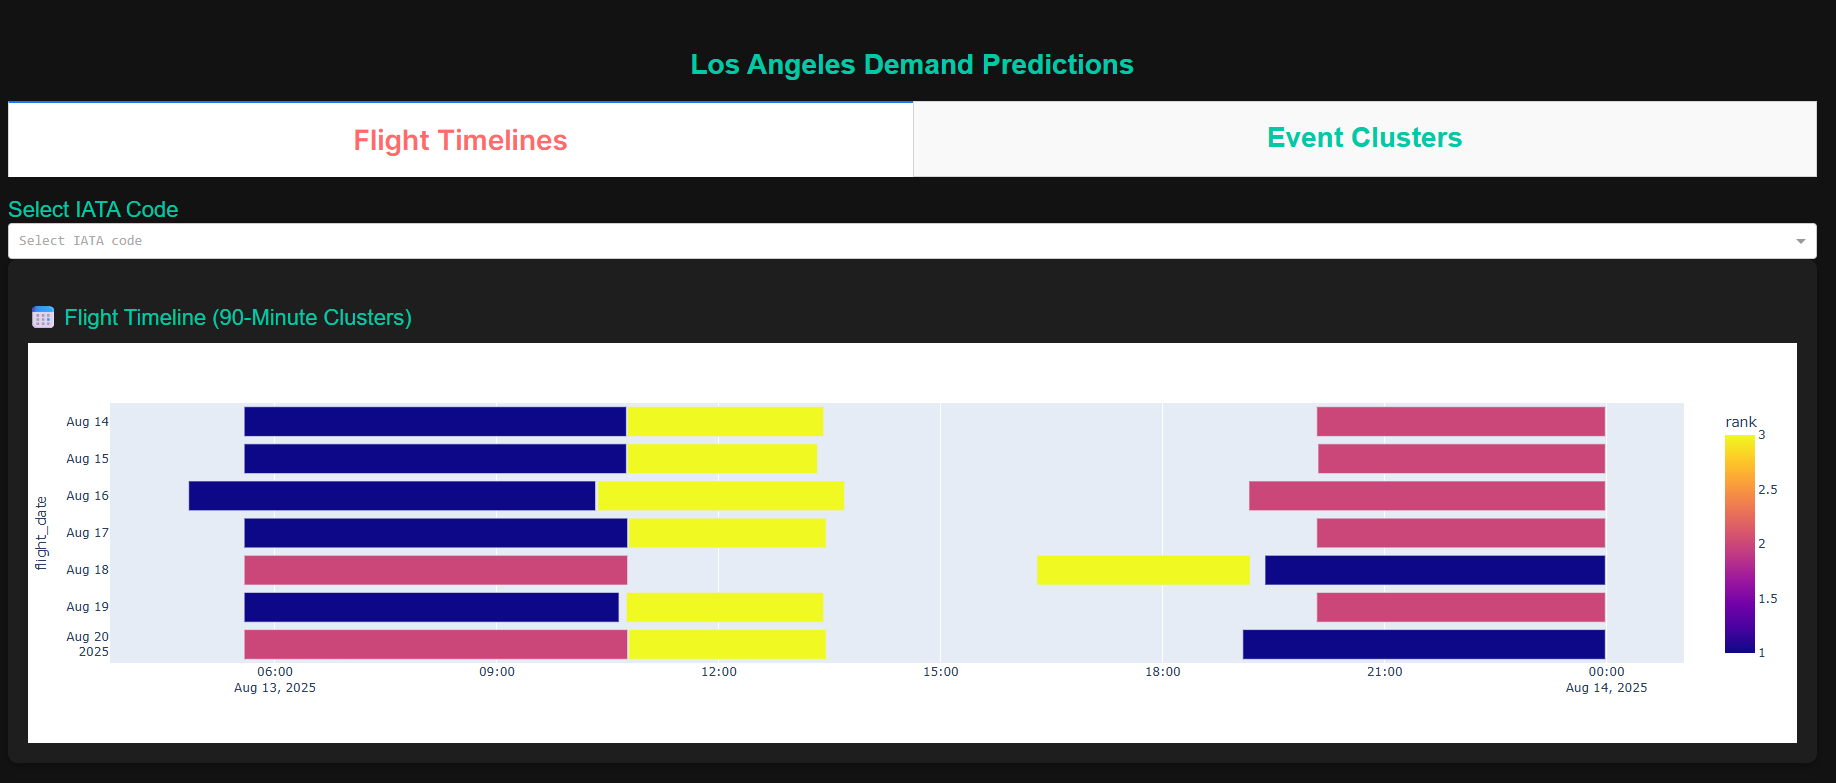
Flight Density Timeline
This chart visualizes incoming flight density across city airports, segmented by time. Each colored bar represents a density‑based cluster, highlighting peak arrival windows. Carriers can use this module to anticipate congestion conditions and stage assets near airport‑adjacent terminals before demand spikes. Designed for predictive pacing, it supports modular planning overlays by aligning dock and linehaul schedules with high‑volume flight influx.